
The hassles of debugging with echo-exit, print r-exit, console.log(), and other debugging tactics that most of us use in our everyday work must be well known to PHP web application developers. Tools like Xdebug, which help us speed up the debugging process and save a tonne of time, greatly improve our productivity.
How to Install XDEBUG
To install x debug with the latest php you can use
` sudo apt install php-xdebug`
If you need to install Xdebug for specific version you can install by changing . with your version
` sudo apt install php.-xdebug`
Example : sudo apt install php7.3-xdebug
To check your php version php -v
Next, open your Xdebug configuration file which should be on the following path:
sudo gedit /etc/php/7.x/cli/conf.d/20-xdebug.ini
Once you open the configuration file, add the following:
1
2
3
4
5
6
7
8
9
10
11
12
13
 # xdebug v2.x
xdebug.remote_enable=1
xdebug.remote_host=127.0.0.1
xdebug.remote_connect_back=1    # Not safe for production servers
xdebug.remote_port=9000
xdebug.remote_handler=dbgp
xdebug.remote_mode=req
xdebug.remote_autostart=true

# xdebug v3.x
xdebug.mode = debug
xdebug.start_with_request = yes
xdebug.client_port = 9003  //Your PHP installed port
Now restart your local server. On my server, it is apache so I restarted it using the following command.
sudo service apache2 restart
Now make a local info.php anywhere in the server to check installed correctly
1
<?php phpinfo();?>
Integrate Xdebug with Visual Studio Code
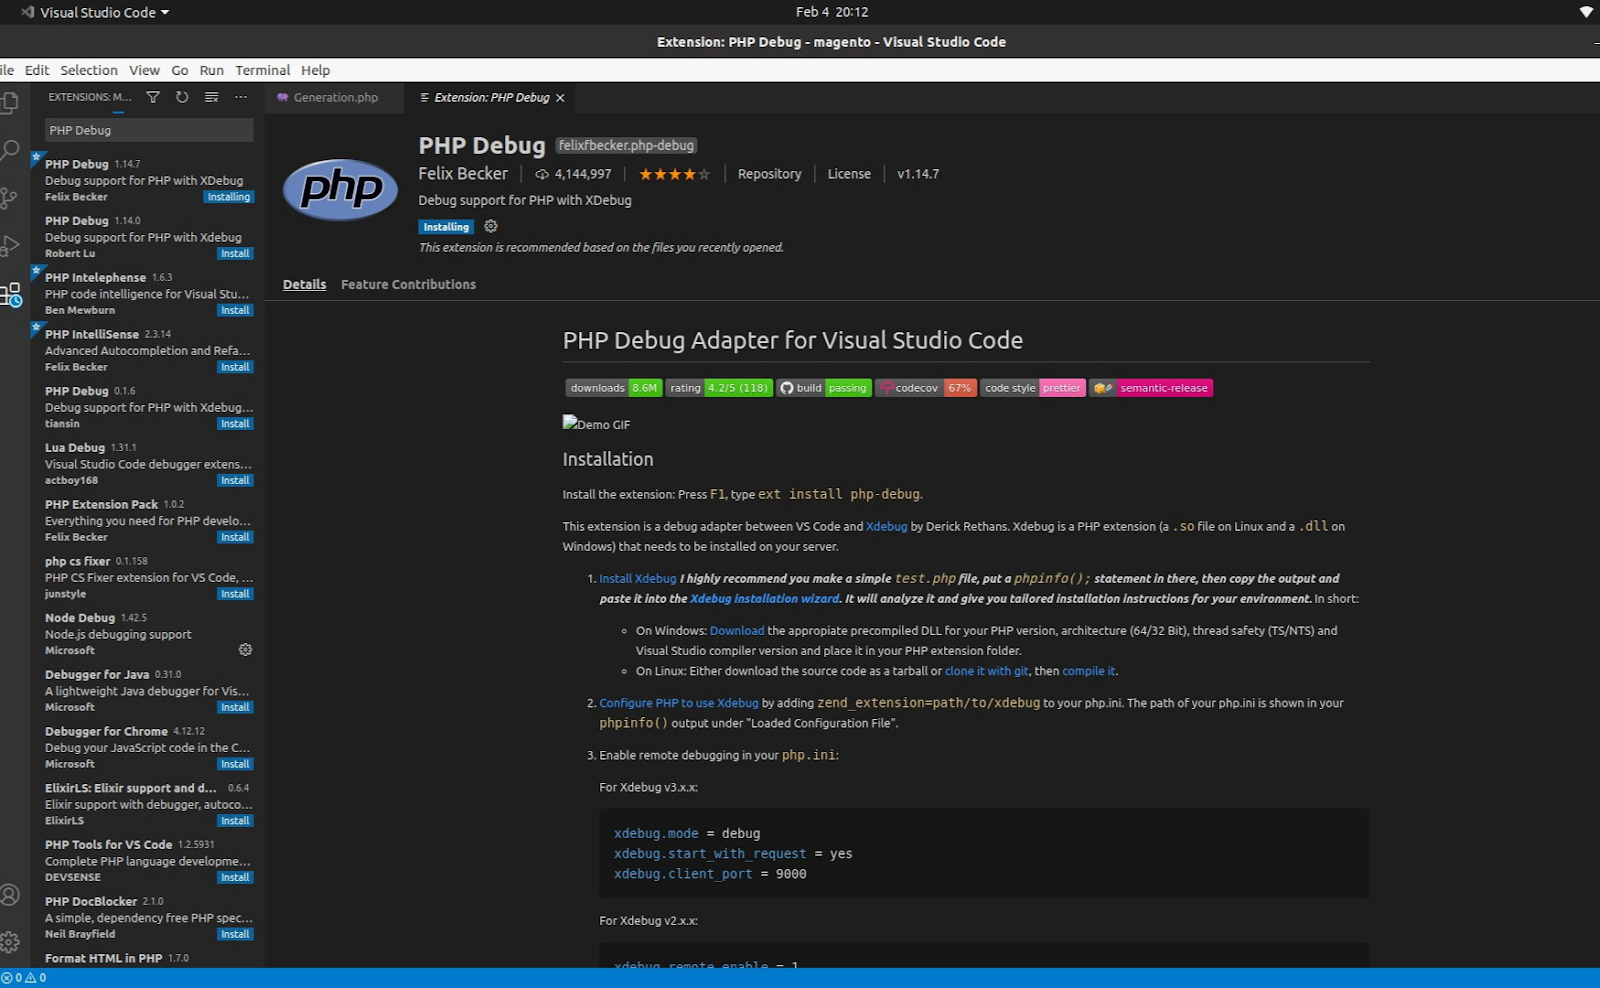
Install PHP Debug Extension By Felix Becker
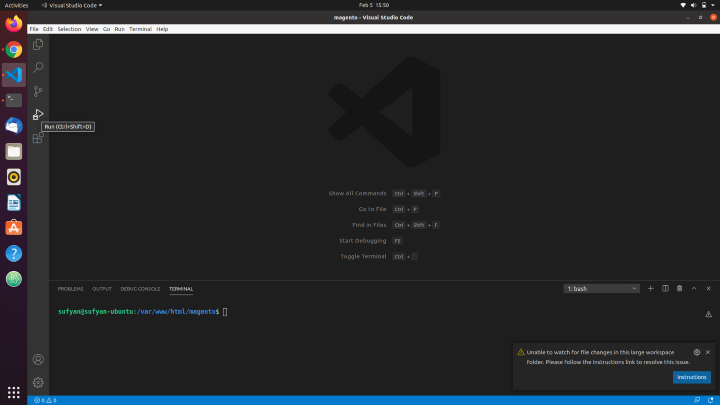
After then goto Run & Debug tab or use shortcut(Shift+Alt+F9)
and create a launch.json file
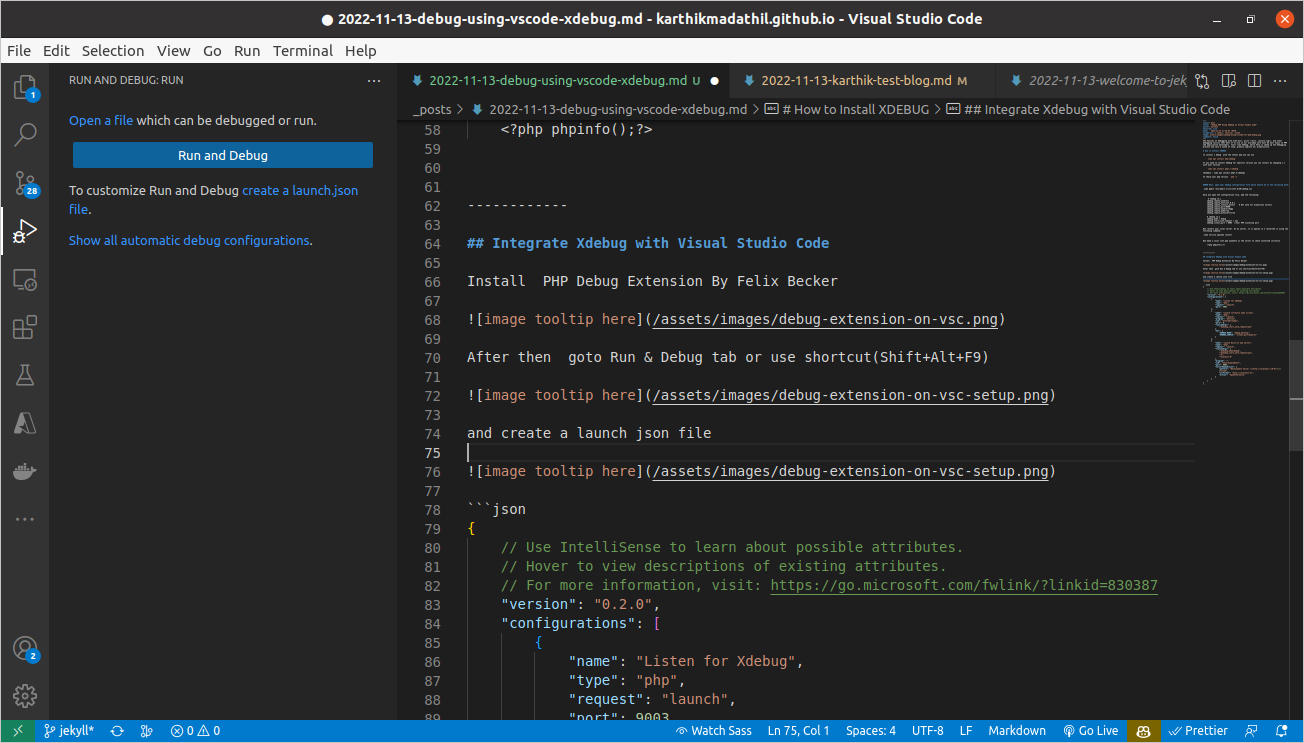
add the following code . We need to listen a port in which Xdebug is installed , thats all.
1
2
3
4
5
6
7
8
9
10
11
12
13
14
15
16
17
18
19
20
21
22
23
24
25
26
27
28
29
30
31
32
33
34
35
36
37
38
39
40
41
42
43
44
45
46
47
48
{
    // Use IntelliSense to learn about possible attributes.
    // Hover to view descriptions of existing attributes.
    // For more information, visit: https://go.microsoft.com/fwlink/?linkid=830387
    "version": "0.2.0",
    "configurations": [
        {
            "name": "Listen for Xdebug",
            "type": "php",
            "request": "launch",
            "port": 9003
        },
        {
            "name": "Launch currently open script",
            "type": "php",
            "request": "launch",
            "program": "${file}",
            "cwd": "${fileDirname}",
            "port": 0,
            "runtimeArgs": [
                "-dxdebug.start_with_request=yes"
            ],
            "env": {
                "XDEBUG_MODE": "debug,develop",
                "XDEBUG_CONFIG": "client_port=${port}"
            }
        },
        {
            "name": "Launch Built-in web server",
            "type": "php",
            "request": "launch",
            "runtimeArgs": [
                "-dxdebug.mode=debug",
                "-dxdebug.start_with_request=yes",
                "-S",
                "localhost:0"
            ],
            "program": "",
            "cwd": "${workspaceRoot}",
            "port": 9003,
            "serverReadyAction": {
                "pattern": "Development Server \\(http://localhost:([0-9]+)\\) started",
                "uriFormat": "http://localhost:%s",
                "action": "openExternally"
            }
        }
    ]
}
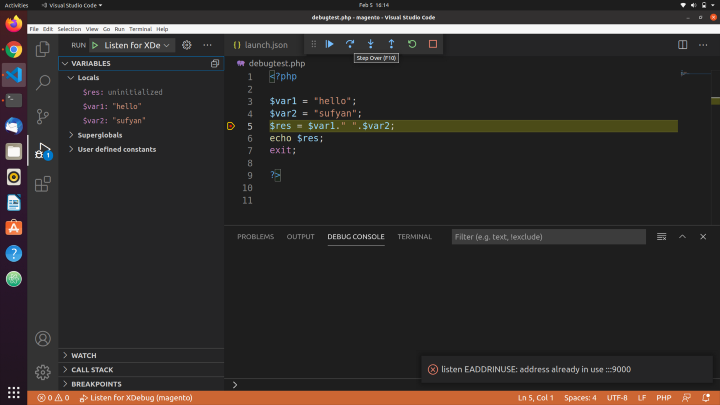
Now our program is ready for debugging. Run this script on you browser and VS Code should open at that breakpoint. Isn’t this cool?!
Now if you see in VS Code there are 4 tabs on the left:
- Variables
- Watch
- Call Stack
- Breakpoints
If you expand Variables, you will see 3 variables of our script. You will see $res as uninitialised because our breakpoint line is not executed yet. Now we have total control on the program execution, line by line. You can execute one line by clicking on Step Over (or press F10). Step Over button is present on a menu above
Now start enjoying your hussle free debugging.
VSCode is an awesome, free, open-source code editor that allows developers to debug anything. It is one of the most popular tools used by developers today and is extremely powerful and efficient. VSCode is a great choice for debugging code because it has a wide range of features that make it easy to find and fix errors. It also allows developers to step through code line by line, set breakpoints, and view the values of variables. Additionally, VSCode offers an integrated terminal, an integrated debugger, and an integrated source control system. This makes it easy for developers to get an overview of the codebase and quickly identify any problems. With VSCode, debugging code is a breeze, and developers can easily find and fix any issues they encounter.